Category:Infographic (SVG)
From WikiMANNia Commons
Media in category "Infographic (SVG)"
The following 67 files are in this category, out of 67 total.
 1984 Social Classes.svg 600 × 550; 11 KB
 A handy guide to avoiding hate speech.svg 533 × 453; 14 KB
 Alterspyramide Deutschland 2010.svg 235 × 325; 22 KB
 Anzahl der Rechtsanwaelte in Deutschland.svg 3,000 × 850; 14 KB
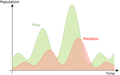
 Babble Curve.svg 800 × 500; 13 KB
 BDSM - Euler Diagram of Acceptance within the Session.svg 600 × 600; 9 KB
 BDSM - Euler Diagram of Acceptance.svg 600 × 600; 7 KB
 BDSM - Euler Diagram of Complete Acceptance.svg 600 × 600; 7 KB
 BDSM - Euler Diagram with Use of Safeword within the Session.svg 680 × 600; 12 KB
 BDSM acronym.svg 1,060 × 530; 5 KB
 BDSM Euler diagram.svg 264 × 230; 3 KB
 British Isles Venn Diagram.svg 256 × 263; 5 KB
 Busbees Venn diagram.svg 600 × 440; 6 KB
 Cock cage - Kali's teeth.svg 800 × 870; 6 KB
 Cock cage.svg 705 × 860; 5 KB
 Cognitive dissonance according to L. Festinger.svg 800 × 400; 6 KB
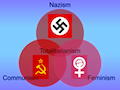 Communism - Nazism - Feminism.svg 400 × 300; 6 KB
 Dissonanz - Spannungszustand.svg 800 × 300; 2 KB
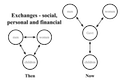
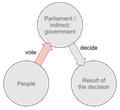
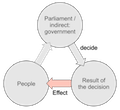
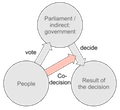
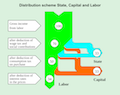 Distribution scheme State Capital and Labor.svg 440 × 350; 13 KB
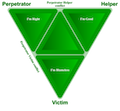 Drama triangle.svg 540 × 500; 8 KB
 Drei-Drittel-Gesellschaft - Infratest 2006.svg 700 × 550; 8 KB
 Elements of group-focused enmity.svg 900 × 500; 11 KB
 Family policy - Men - Women - Government - Children.svg 420 × 290; 5 KB
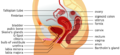 Female anatomy.svg 1,172 × 534; 77 KB
 Female BDSM roles - Male BDSM roles.svg 700 × 320; 6 KB
 Female Preferred BDSM roles - Male Preferred BDSM roles.svg 700 × 320; 5 KB
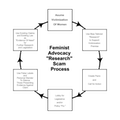 Feminist advocacy.svg 860 × 860; 12 KB
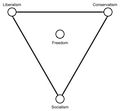 Freedom - Liberalism - Conservatism - Socialism.svg 600 × 553; 4 KB
 Gartner Hype Cycle.svg 800 × 500; 6 KB
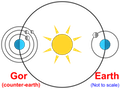 Gor - Orbit-diagram.svg 800 × 596; 5 KB
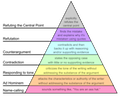 Graham's Hierarchy of Disagreement.svg 810 × 650; 22 KB
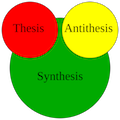 Hegel's dialectic - Thesis - Antihesis - Synthesis.svg 300 × 300; 2 KB
 Hierarchy-God-Man-Woman-Child.svg 500 × 442; 6 KB
 How Women Rate Men.svg 1,200 × 1,200; 5 KB
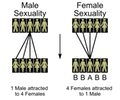 Hypergamy - Male Sexuality vs. Female Sexuality.svg 300 × 250; 7 KB
 Induction-Deduction.svg 750 × 400; 7 KB
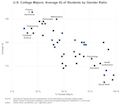 IQ by College Major Gender.svg 740 × 645; 10 KB
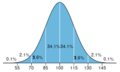 IQ distribution.svg 284 × 171; 15 KB
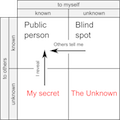 Johari Window.svg 352 × 352; 11 KB
 Labioplasty - Methods.svg 744 × 1,052; 16 KB
 Laffer Curve.svg 470 × 315; 3 KB
 Legitimation Input.svg 480 × 440; 6 KB
 Legitimation Output.svg 480 × 440; 6 KB
 Legitimation Throughput.svg 480 × 440; 7 KB
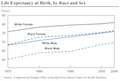 Life Expectancy - USA (1970-2004).svg 460 × 310; 4 KB
 LotkaVolterra.svg 1,320 × 830; 10 KB
 Mens groups.svg 400 × 300; 4 KB
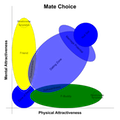 Mental Attractiveness versus Physical Attractiveness.svg 1,000 × 1,000; 10 KB
 Move the Overton window.svg 500 × 200; 3 KB
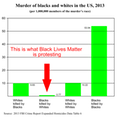 Murder and Race in the United States in 2013.svg 460 × 450; 8 KB
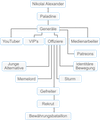 Organigramm Reconquista Germanica.svg 734 × 881; 30 KB
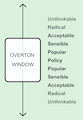 Overton Window diagram.svg 400 × 580; 8 KB
 Sexual freedom versus Reglated sexuality.svg 3,500 × 2,500; 14 KB
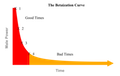 The Betaization Curve.svg 380 × 240; 4 KB
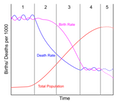 The Demographic Transition Model including stage 5.svg 329 × 281; 15 KB
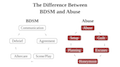 The Difference Between BDSM and Abuse.svg 540 × 300; 15 KB
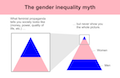 The Gender Inequality Myth.svg 792 × 517; 6 KB
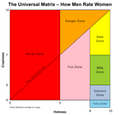 The Universal Matrix - How Men rate Women.svg 1,500 × 1,438; 9 KB
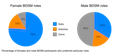
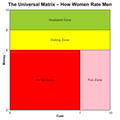
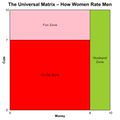 The Universal Matrix - How Women rate Men.svg 1,500 × 1,500; 5 KB
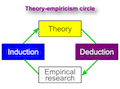 Theory-empiricism circle.svg 570 × 425; 4 KB
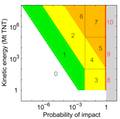 Torino scale multilingual.svg 512 × 507; 3 KB
 Underbust corset - clothing patterns.svg 1,560 × 1,412; 26 KB
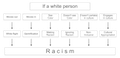 Whatever a white person does he is always made out to be racist.svg 1,000 × 480; 10 KB


.svg)


